Open source · traffic video analysis · Python

Traffic footage, turned into numbers

traffic-video-analysis is an open-source Python library. It takes aerial or elevated footage of real traffic, stabilizes the camera onto the road plane, tracks every vehicle, and returns speeds, queue counts, and stop events with sub-frame timing.

It is a second, separate repo from traffic-sim. traffic-sim simulates a city from its OpenStreetMap road network. traffic-video-analysis measures traffic that already happened, from video.

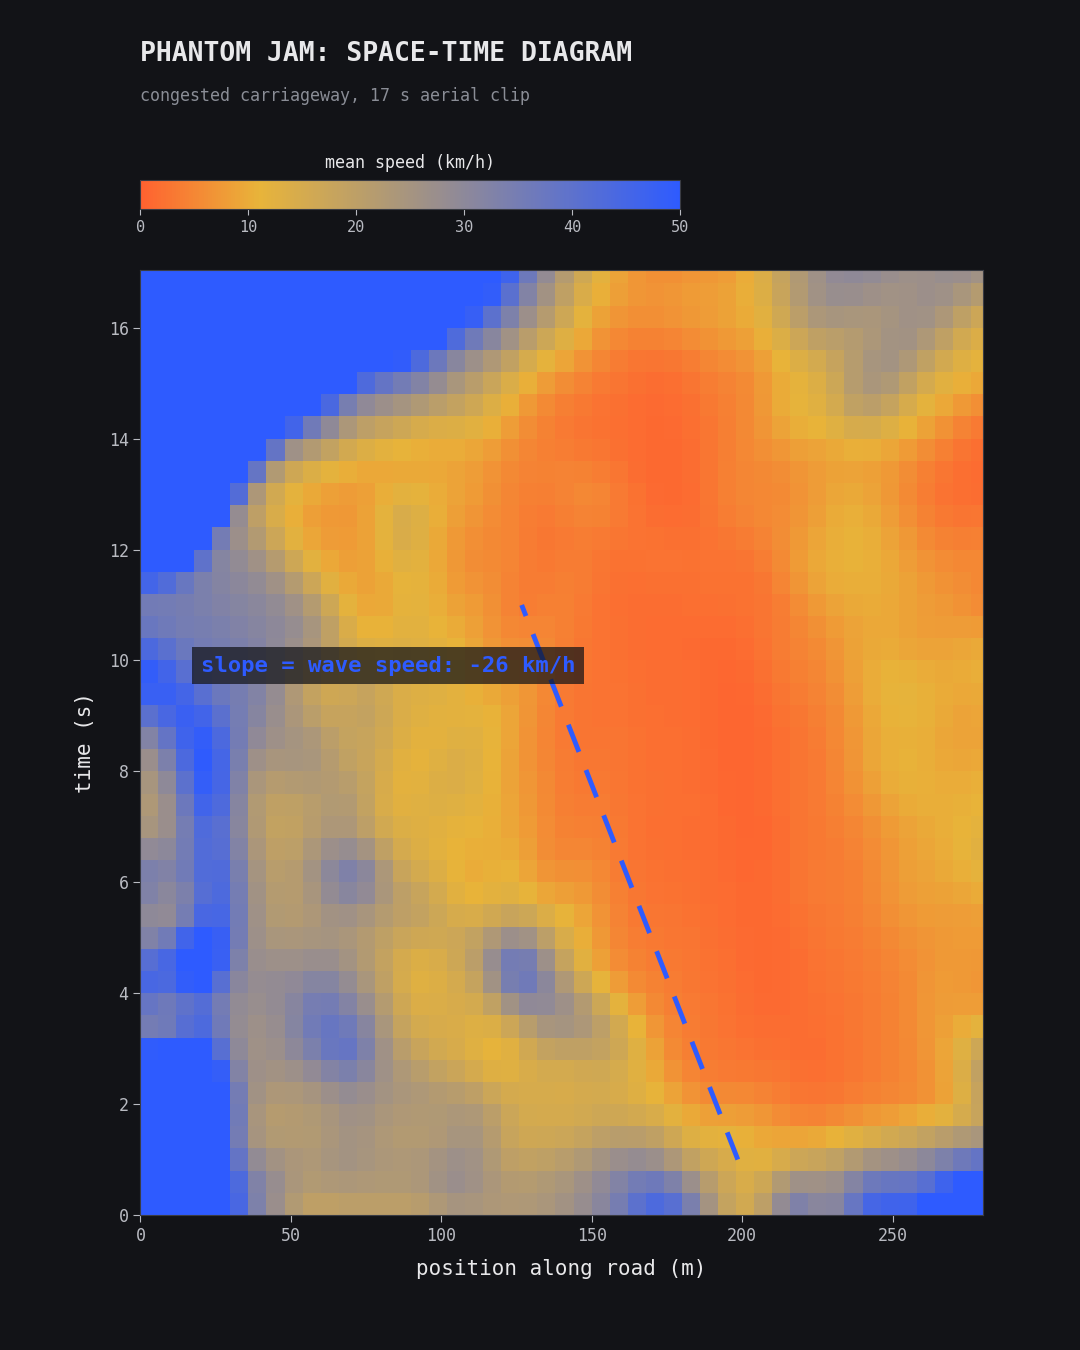
Space-time diagram of the jam: position along the road on the x axis, time on the y axis, cells colored by mean speed, with the stopped band sloping backward against traffic.
What comes out the other end

Every car's position and speed, per frame, in road coordinates: 17 seconds of aerial footage as one picture. The jam is the orange band, and it slopes backward.

The two shorts built with it

← the library's only two runs, published

What it does

← the short version
01 · the camera
World plane first

A planar road seen from above means camera motion is exactly a per-frame homography. Each frame is registered into a reference plane, with RANSAC rejecting the moving vehicles: about 1,300 inliers per frame on the EP-03 clip. Camera pan cancels, and a stopped car becomes a fixed world point.

02 · the vehicles
Detect and track

YOLO plus ByteTrack on the native-resolution frames. The weights matter: VisDrone-trained YOLOv8x finds about 170 vehicles on a frame where a COCO-trained model finds 4. The README is blunt that this is a domain gap and that tiling does not rescue it.

03 · the numbers
Speeds, queues, stop events

Speed comes from a constant-acceleration Kalman filter with an RTS smoother per track, so velocity is a filter state and never a finite difference. A road centerline turns each car into one arc-length coordinate, and moving-stopped hysteresis turns that into stop-onset events with sub-frame timing.

Version 0.1.0, with one production run on the books and the repo honest about it: on the EP-03 hero clip, 1,541 tracks and 94,486 observations resolved to 726 world tracks and 154 stop-onset events. Every stage writes plain JSON and PNG to a work directory, so each step is inspectable and cacheable. The long version, with the full README →

Go deeper

← the code and the write-ups, all public
MATH vs. VIBES on YouTube

New builds and episodes land on the channel

Eric builds the model, Thomas trusts his gut, and the whole thing gets settled on camera. The tools that referee it get their own shorts and build diaries.

▶ Subscribe on YouTube