EP 03 · Chicago traffic · two parts

Can vibes plan a city?

Two old friends argue about the future. One builds a math model. The other trusts his gut. A scoreboard keeps it honest, one point per episode.

This time the argument is Chicago: the most congested city in America on INRIX's scorecard, and its tenth on TTI's. Thomas has lived there 10 months and says he owns its traffic. Eric simulated the whole city.

Eric, the MATH side of the show
MATH
Eric. PhD engineer. Builds the model, publishes the code.
Thomas, the VIBES side of the show
VIBES
Thomas. Ten months in Chicago. Reads the room, not the chart.
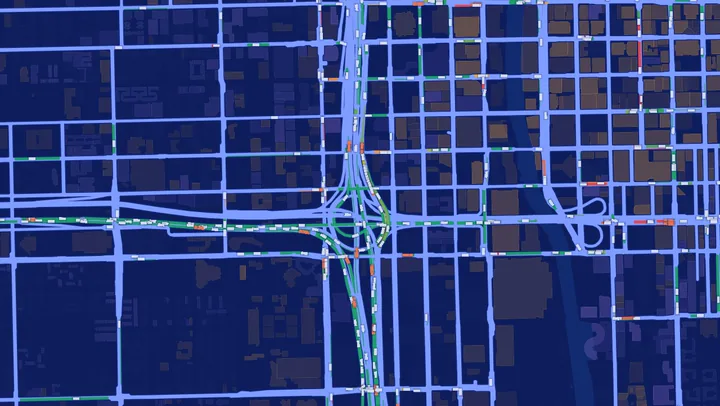
The simulated Chicago street network: the Loop grid, the expressways and the lakefront, with vehicles on every lane.
The simulation

The loop zone, imported from OpenStreetMap: 23,833 lanes and 2,217 signal programs, running before anybody proposes a fix.

How the show works

← three rules, agreed on camera
01 · the bet
Rules first, on camera

Eric bets that a model can rank road upgrades and a gut cannot. The terms get argued out loud before anybody sees a number.

02 · the cold reveal
No preview for the gut

Thomas sees the model for the first time while the camera is rolling, then explains why it is not the thing he was asked about.

03 · the tally
One point on the board

Every episode ends with a verdict and one point, disputed loudly and logged on the season Tally.

Part 1: the baseline

Part 1 thumbnail: the bet over Chicago traffic
Part 1 · Sep 2, 2026 · 24:48

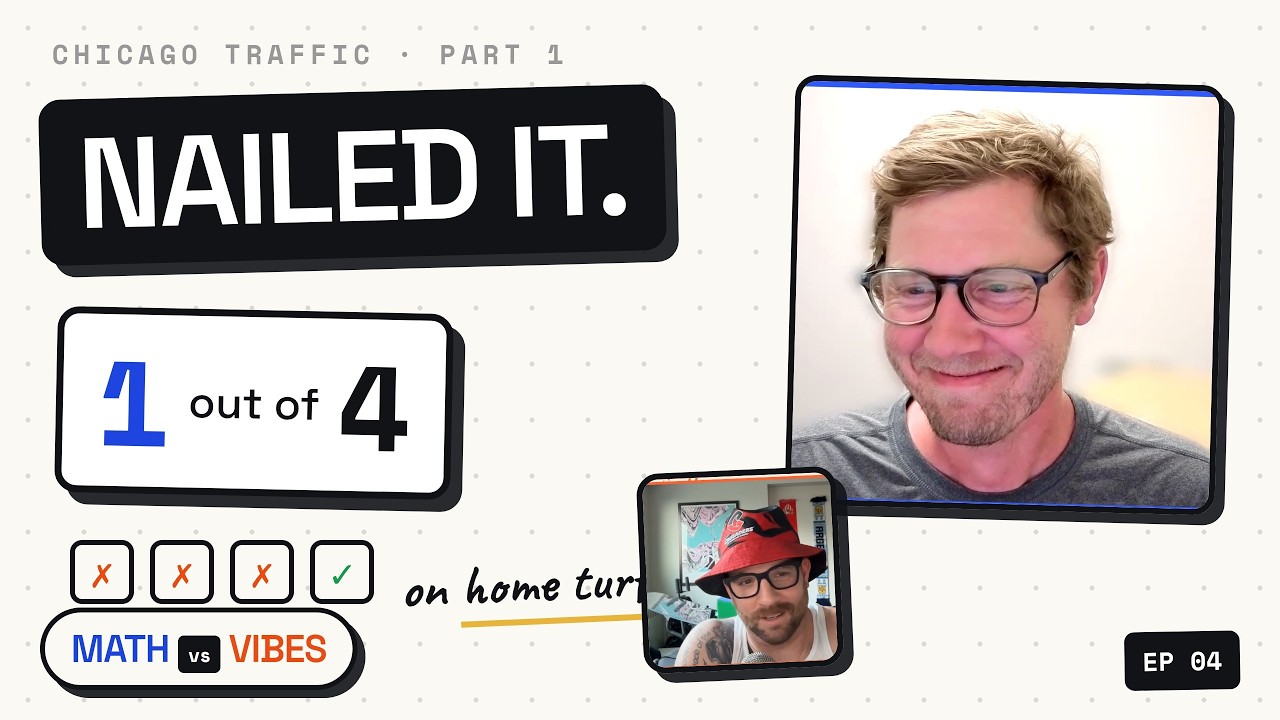
How Well Do You Know Chicago Traffic? A Local Got 1 in 4 Right

First the city: a Chicago geography crash course, four congestion scorecards that disagree about this one city by 33 hours a year, and the 29.6-minute commute that sits inside a spread of 3.4 minutes across eight big metros.

Then the quiz. Four questions on his own home turf: the intersection the crash data ranks first, the Hillside Strangler, the $806M Jane Byrne rebuild, and a bracket for the most annoying intersection in the city.

"Two people, one car, feel the vibes, you got a plan."

He finished at 25%. His defense: 25% is better than 0%.
Take question 1

← the plate he saw, no street names
Unlabelled until you answer Road geometry © OpenStreetMap contributors
Question 1 of 4 · Part 1, 14:53

Chicago’s worst intersection. Where is it?

79th / Stony Island / South Chicago Ave, Avalon Park. Crash-data #1 in Chicago in both the 2021 and the 2026 study, 687 crashes and 2 fatalities in the latest. It is also the top pick in the r/chicago “worst intersection” thread. Eight independent sources. Chicago Journal / 1Point21 (CRI 293, 2018–20) · Duncan Law Group 2026 update · r/chicago

Thomas said: “the Crotch.”

Part 2: the simulation grades him

Part 2 thumbnail: can vibes fix Chicago traffic
Part 2 · Sep 10, 2026

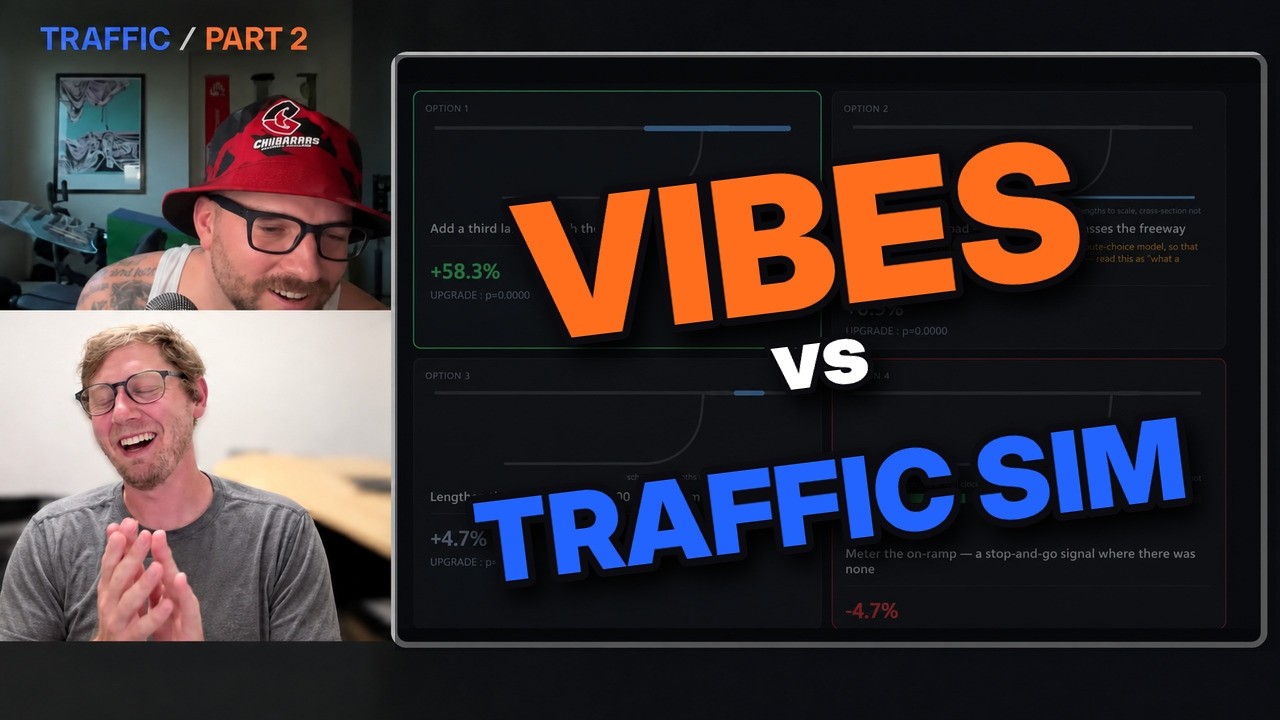
Can Vibes Fix Chicago Traffic? We Built a Simulation to Find Out

Thomas's upgrade list for Chicago goes up against the sim: the city imported from OpenStreetMap down to the turn restrictions, then run scenario by scenario, so two proposed fixes get ranked instead of argued about.

The loop zone alone: 23,833 lanes, 2,217 signal programs, 6,738 homes and 2,426 workplaces, all of it moving before anybody touches a thing.

The phantom jam gets measured on the way through. 17.04 seconds of aerial 4K drone footage, 426 frames, turned into 154 stop events by an open-source library that is now public.

The point is settled in Part 2. VIBES +1. Vibe sampling took the point, and the season lead with it.

Go deeper

← the code and the slides, all public
Season 1 · the Tally after Chicago
Math 1 vs Vibes 2

Airports, the World Cup, then Chicago traffic. Three questions, three points, one running argument. See the whole Tally →

One email when a new arc lands · that's the whole deal