Episode 03 · traffic
Can vibes
plan a city?

One city. Three congestion problems. Four upgrades each — he picks one, by vibes.

He needs 2 of 3 for the point
season so far
Math vs Vibes 1–1
mathvsvibes.com
Tonight · the run of show

Five parts. One bet.

1
Introwhere we left it, and the score
5 min
2
What's the bet?can vibes plan road upgrades?
10 min
3
Setting it upa quiz, then the numbers
15 min
4
The betthree problems, three picks
15 min
5
Closingthe score, and what to watch this week
10 min
Times are a vibe, not a contract.
Chicago transit planning review · the map, for the rest of us

Where he's pointing, and what he'll call it.

1

Chicago is talked about in sides — north, west, south.

2

Downtown is the Loop, and nearly everything else gets described by where it sits relative to it.

3

The expressways have names, not numbers.

City limits & roads © OpenStreetMap contributors (ODbL)
Chicago transit planning review · how bad is it, actually

America's most congested city. Also its tenth.

INRIX2025 data
112 hrs
#1 in America
INRIX2024 data
102 hrs
#1 tied with NYC
TTI2024 data
87 hrs
#10 of 494
TomTom2024 data
79 hrs
no rank published
Redditgeneral traffic threads
LA, Boston and Miami own the complaints
≈#4 by feel
INRIX Global Traffic Scorecard · TTI Urban Mobility Report · TomTom Traffic Index · Reddit row is thread titles and top-comment snippets across ~12 general traffic threads, not a poll
Chicago transit planning review · the same question, asked of the clock

Eight cities, twenty-eight hours apart. Four scorecards, thirty-three.

— hrs a year separates the best of these eight metros from the worst
— hrs a year separates four scorecards measuring Chicago alone
ACS 2024 1-year, tables B08136 + B08301 · car, truck or van commuters · annual figures assume 250 work days, two trips a day
The local · our sample size

One Thomas resides here.

lots of vibes
Vibes available · Thomases per metro
New York
0
Los Angeles
0
Houston
0
Phoenix
0
Chicago
1
off the chart
City boundary © OpenStreetMap contributors, ODbL. Pin location is a bit, and so is the chart.
The model · the board we're actually playing on

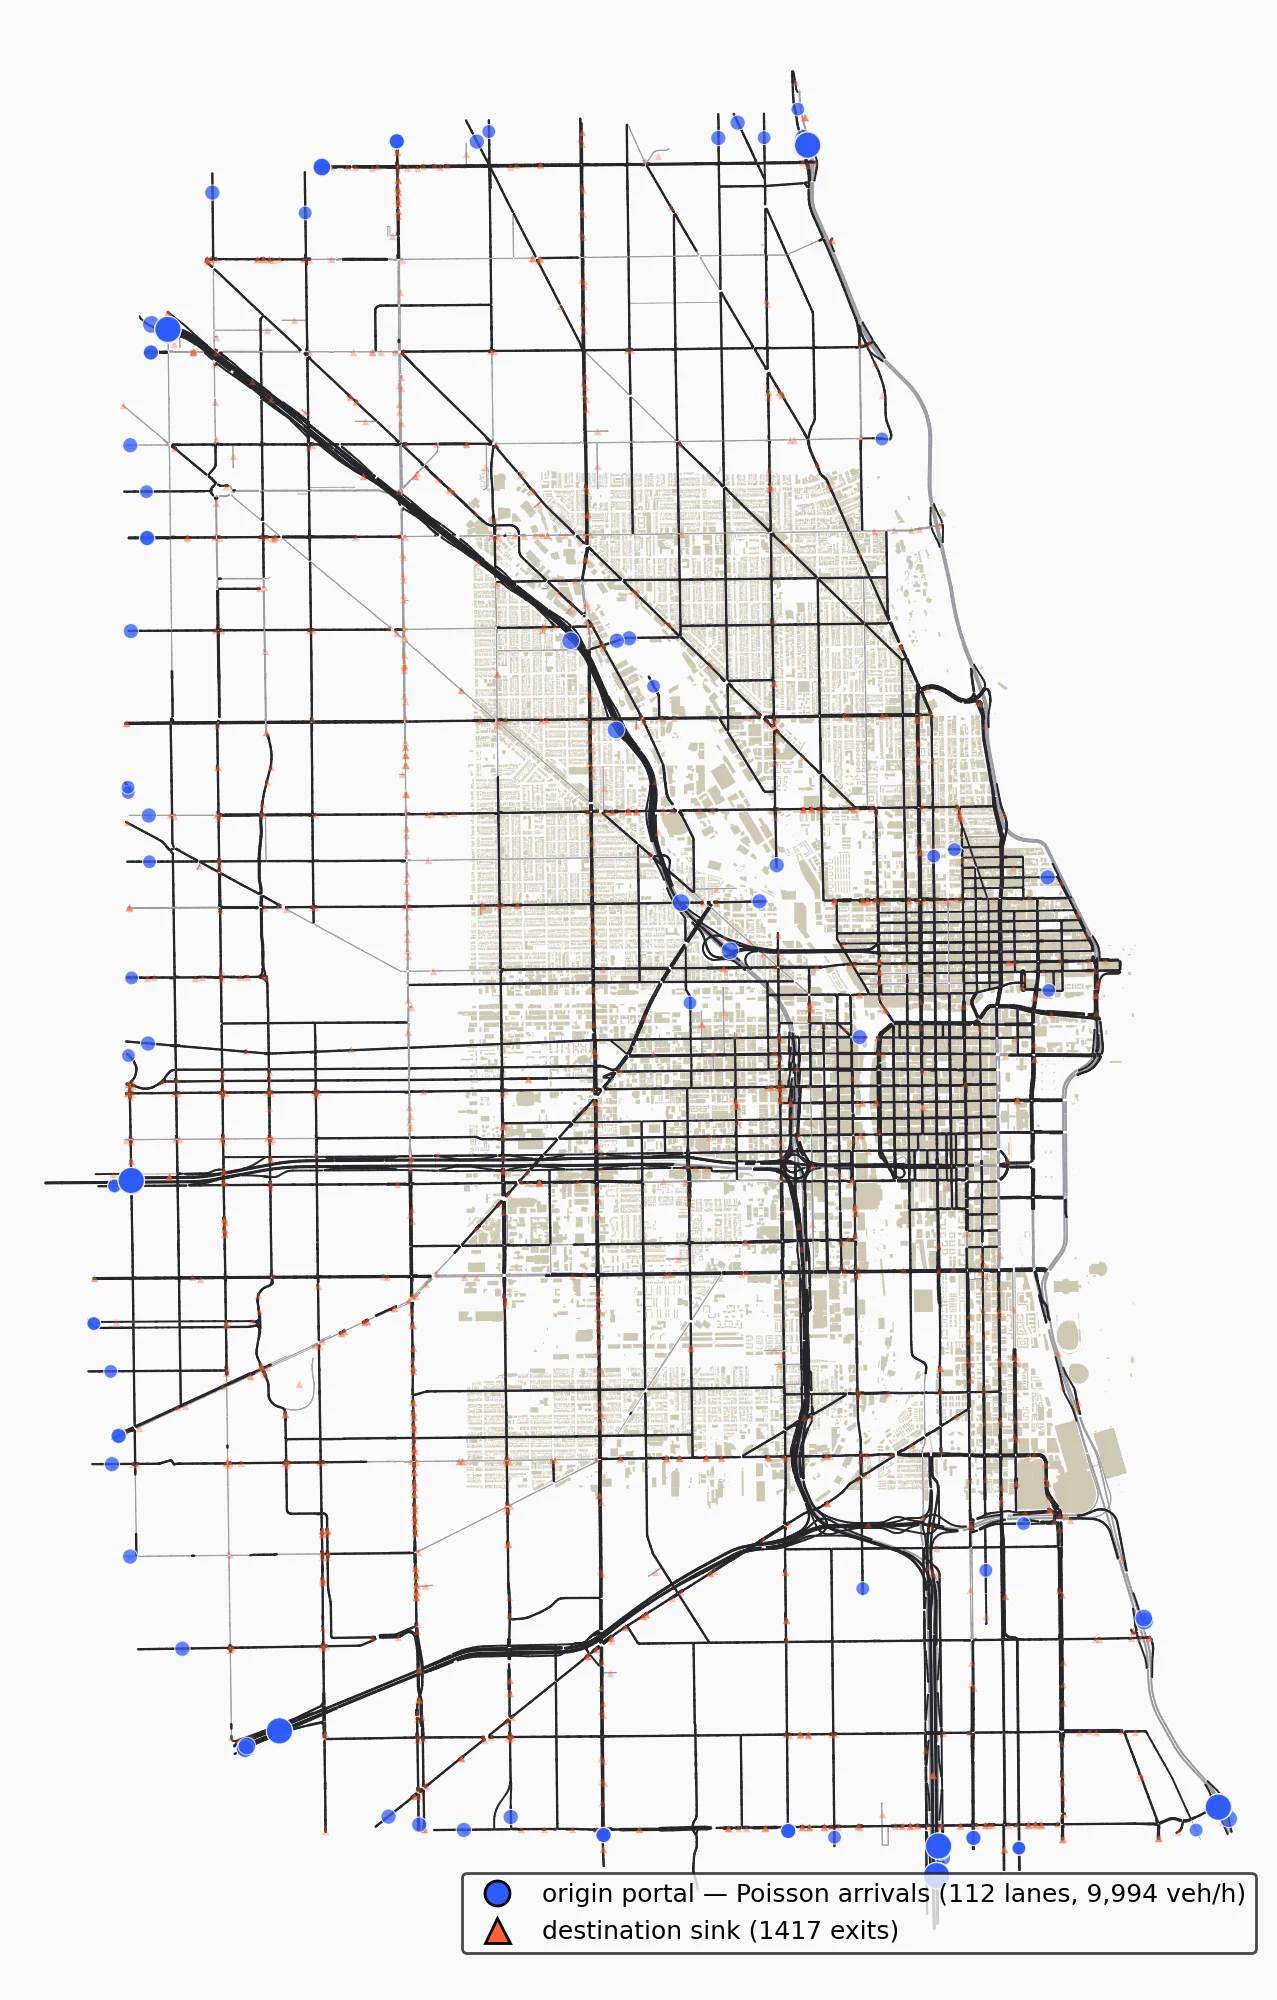
Not a diagram. Every lane, every light.

Network
23,833 lanes. 2,217 signal programs. Imported from OpenStreetMap down to the turn restrictions — nothing here was drawn by hand.
Demand
112 ways in. 1,417 ways out. Cars arrive at the edge at 10,000 an hour and head for somewhere.
Score
Time lost against a free run. Per car, per second, added up.
phantomjam.com
The imported Chicago network with demand overlaid — blue origin portals sized by arrival rate, orange destination sinks at the exits, building footprints beneath
MATH vs VIBES · EP 03
1/3