The highest-scoring World Cup since 1970
2026 is averaging 2.91 goals per game deep into the knockout rounds. No World Cup since 1970 has scored faster.
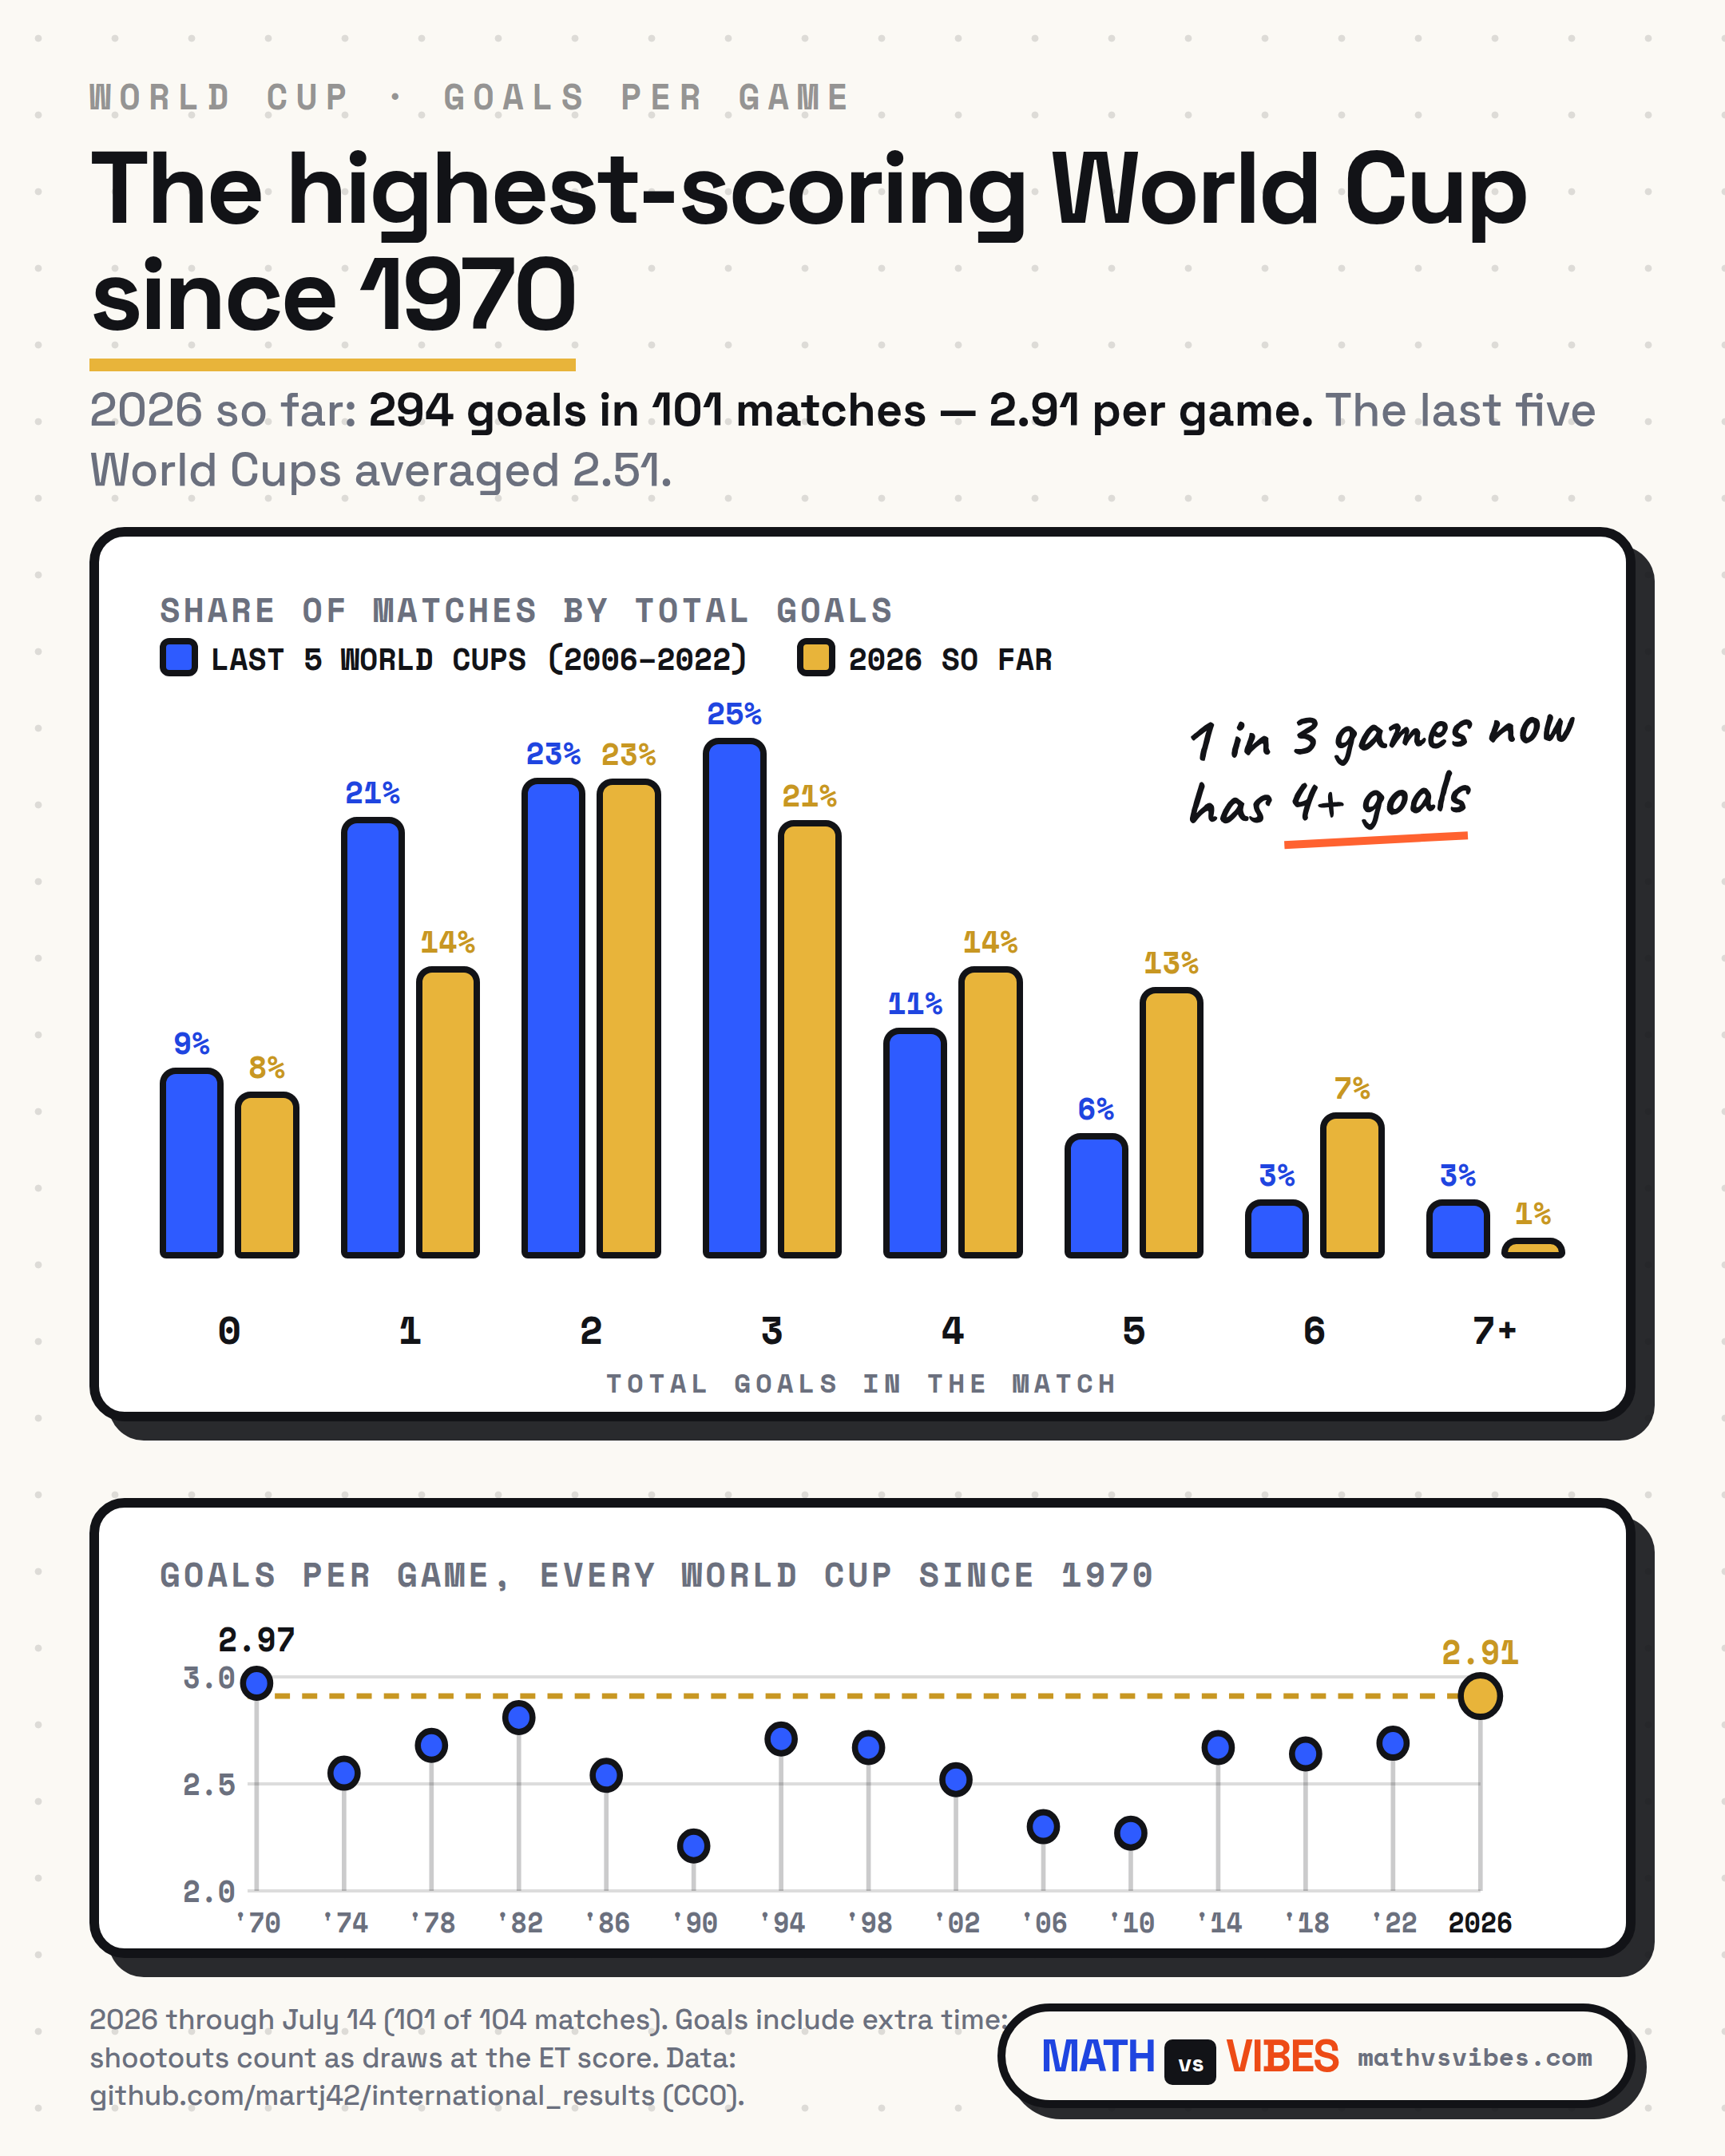 Open full chart ↗
Where this came from
Halfway through the knockout rounds it stopped feeling like variance: everything was ending 3-2, extra time kept producing goals, and the "boring World Cup" takes had quietly disappeared. So we computed it. With results through July 14 — group stage plus knockouts to the semifinals — the tournament stands at 2.91 goals per game. The only World Cup above that number in the last 56 years is Mexico 1970 itself (2.97) — the Pelé, Jairzinho, 4-3-in-the-semifinal one. Every cup since has hovered around 2.6-2.7. Whatever this tournament is, it is not normal, and Sunday's final moves the number one last time.
What is the highest-scoring World Cup ever?
Switzerland 1954, and it is not close: 5.38 goals per game, roughly double the modern rate. That tournament also produced Austria 7-5 Switzerland — twelve goals in a single match, the far-east outlier on any chart of World Cup scorelines. But mid-fifties football is a different sport played under the same name, which is why the headline on this page says "since 1970" instead of "ever." In the modern era the ceiling is Mexico 1970 at 2.97 goals per game, and 2026's 2.91 is the only tournament since to come within reach of it.
How many goals per game is normal for a World Cup?
About 2.6 to 2.7 — every World Cup of the last half-century has landed in that narrow band. It matches the sport's baseline: international football runs about 2.7 goals a game, and roughly one match in four ends level, which is the arithmetic the EP 02 bracket engine is built on. Against that band, 2026's 2.91 is a real deviation — a couple of tenths of a goal per game, which across a 104-game tournament works out to roughly twenty extra goals nobody scheduled. That stability is also what makes the chart at the top of this page readable at a glance: five decades of near-flat line, then 2026.
Why were there so many goals at the 2026 World Cup?
The honest receipt: one tournament cannot prove a cause, but the data narrows the suspects. The obvious one is the expanded format — 48 teams in 12 groups of four, 72 group games plus 31 knockout games, 104 in all — and more group matches between mismatched sides should mean more goals. The scoring rate says that is not the whole story. The mid-group-stage snapshot ran 3.03 goals per game over the first 40 matches; with the knockout rounds through the semifinals folded in, the tournament still stood at 2.91. The knockouts pulled the number down, but nowhere near back to the 2.6-2.7 band — and extra time kept producing goals instead of killing them off. Whatever was driving it survived the rounds where the stakes are supposed to strangle it.
Was the 2026 World Cup full of upsets too?
No — and that is the interesting part. High-scoring did not mean chaotic: through the semifinals, 18 of 24 knockout favorites advanced (model Brier score 0.162), and 4 of the 6 upsets that did land were penalty shootouts, the one place the math openly gives up. The goals went up; the pecking order mostly held. If anything, the 2026 story is the opposite of chaos: the two teams the pre-tournament Elo table ranked #1 and #2 met in the final.
What was the score of the 2026 World Cup final?
Spain 1-0 over Argentina, in extra time — the highest-scoring World Cup in 56 years signing off with the lowest-scoring way a match can be won, dragging the average down one last notch. It was also the first final ever played between the two countries; the full 74-year record is its own receipt, and the model priced the match 53/47 Spain. For the EP 02 bracket bet the final changed nothing — both brackets had crowned Argentina, so the score froze at MATH 42 · VIBES 48 and the point went to Vibes. The verdict, concession included, is on camera in the finale.
The post-final refresh of the public parquet is what settles the goals-per-game number for the record books; the query below returns it the moment the 2026 rows are complete.
Check it yourself
One query over the full match record ranks every World Cup by scoring rate:
SELECT year(date) AS wc,
       round(avg(home_score + away_score), 2) AS goals_per_game,
       count(*) AS games
FROM read_parquet('https://data.mathvsvibes.com/wc/results.parquet')
WHERE tournament = 'FIFA World Cup'
GROUP BY 1 ORDER BY 2 DESC;
-- heads up: the public parquet updates in batches — right now its 2026
-- rows are a mid-group-stage snapshot (3.03 over the first 40 games).
-- Full knockout rounds land with the post-final refresh. 1970: 2.97 ·
-- 1954: 5.38 if you go back far enough, but that's a different sport
Receipt trail: built during finals week 2026; the final on July 19 will move the number one last time. Source data: martj42/international_results (CC0).