MATH vs VIBES · Episode 02 · The World Cup
Fill in your bracket.Who wins the whole thing?
The group stage is done. 32 teams left, 31 games, one trophy — Thomas gets a
blank bracket and a pen. No spreadsheets, no models.
VIBES: "Easy. I watch football."
MATH: "Before you write a name down — napkins first."
2,147,483,648
ways to fill it in · 231 — one fork per game · you pick exactly one
If the gut can beat the model anywhere, it's here. →
Presenter notes — P1 · the question
Beat: let Thomas talk first ("easy, I watch football"). Then the number,
deadpan: two billion — "and you get to pick exactly one."
Cocky: "I don't need to watch a single game to fill this in."
Hole to feed him: 2.1B treats every game as a coin flip — nobody thinks
the #32 seed wins it all. If he lands it, concede on camera: "right — the entire show is how
much smaller each of us can make that number."
The opening move — one number per team
Every team gets one number.
The model can't see badges, form or history — one rating per team is its whole
worldview. All 252 rated teams start at the same 1500 .
Zero opinions.
▶ Replay 1872 → today
MATH: "One number per team. That's all I need." — logged, pre-tournament
49,477 games, oldest first. Win as expected: barely moves.
Upset: moves a lot. A rating is compressed game history — nothing else.
now spin the globe — where do the numbers live? →
Presenter notes — P2 · one number
Beat: say the boast out loud before hitting replay — "one number per
team, that's all I need" — then point at the chip: "it's logged, hold me to it."
(P6 red-pens this exact quote when I upgrade to two numbers.)
Cocky: "I have never watched Ecuador play. The column doesn't care."
· "Your twenty years of watching football compresses to about four Elo points."
Holes to feed Thomas: ① a single number can't see styles or matchups —
rock-paper-scissors teams exist (concede at P6, it's planned). ② ratings are backward-looking:
injuries, a new manager, a golden generation aging out — the number finds out after the
games. Let him land that one clean. ③ if he asks about home advantage: the replay gives the
home side +100 — the model knows about crowds, sort of.
Planted bit — the recent era: nudge him into asking "can we replay just
the modern era / last 20 years?" — and the deck CAN'T. That's the point: I compressed 154
years into a column and never thought to build a recent-era view. "Ohh… I didn't think that
would be important." Let him complain / enjoy it — it's his first real point on the board.
Recovery line if I want one (spoken, not shown): 30,574 of the 49,477 games — 38% of all
internationals ever — happened in just the last two decades , so the column is mostly
modern signal anyway. Do NOT promise a fix on camera unless I mean it.
Don't: explain K-factors here. That's the update page's job.
The same replay — seen from orbit
Where the numbers live.
Watch the world learn football. A country stays blank until its first
international — from that day it wears its rating: math-blue above the
1500 start, vibes-orange below. 154 years, one pass.
▶ Replay 1872 → today
every color is the column from last page, wearing a map — nothing new is computed
Watch the world learn football
1872 → 2026 · every country colored by Elo rating ·
so what does a 200-point gap actually buy? →
Presenter notes — P2b · where the numbers live
Beat: hit ▶ and say nothing for the first seconds — the camera opens
tight on 1872 Britain, TWO countries on an empty planet, then pulls back on its own as the
game spreads (the Europe blow-up fades in once the wide shot makes Europe tiny). Narrate
the fills: 1900s Europe ·
1916 Copa América lights South America · the 1950s–60s decolonization wave floods Africa
and Asia · 1991–92 Yugoslavia shatters into its successors and the Baltics + post-Soviet
republics re-light. (Data quirk, don't miscall it: there is no "USSR" team in the record —
Soviet-era games sit under "Russia", so the east never goes fully dark.)
Cocky: "154 years of football in thirty seconds. You're welcome."
· "I still haven't watched anyone play." (The wearing-a-map line is printed on the chip —
point at it, don't read it.)
Hole to feed Thomas: "why is Africa orange — are they worse, or do
they just never get to play the blue teams?" Concede it's a real question: regions barely
mix outside World Cups, so one global number strains across confederations
(region-connectivity numbers exist if he pushes). Foreshadows the honest limits of Elo.
Area lies: if he says "Russia looks huge" — yes, maps over-weight big
mediocre countries; Uruguay is a speck with two stars. The column stays the honest view;
this is the establishing shot.
Don't: add or promise an era filter — the "can't replay just the
modern era" planted bit lives on the previous page and must survive this one too.
Backing the boast ① — a gap becomes a probability
The gap is the probability.
Δ = +200
Drag the gap. The blue curve is the model; the orange dots are
17,915 real games.
favorite's expected score
.760
underdog .240 — sums to 1
real games at this gap: ~.687
E = 1 / (1 + 10−Δ/400 )
curve says .760 — real games say .687. hmm.
Presenter notes — P3 · gap → probability
Beat: the slide opens sitting at Δ=+200 — it answers the map page's
closing scrawl on arrival: a 200-point gap buys you .760 . Say that, then drag.
Cocky: "I didn't fit this curve — it's older than me. 17,915 real games
ride it anyway." · Drag to +400: "ten-to-one. That's all 400 points means."
Hole to feed Thomas: the orange dots sag under the curve on the right —
model .760, reality .687. Let him land "your own dots disagree with your curve." Concede it,
hold the fix: "hold that thought — the real engine closes exactly that gap." Do NOT explain
the fitted engine here.
If he asks "why this curve": it's the only S-curve that gives everything
we need — Δ=0 → coin flip, more gap → more probability, never leaves 0–1, the two sides sum
to 1, flattens at the top. Also: only the difference matters — 1700-vs-1500 plays
exactly like 2200-vs-2000.
Don't: derive anything. One slider, one number, move on.
Backing the boast ② — how the number learns
After each game, nudge by the surprise.
new = old + K · ( actual − expected )
Underdog A 1500 meets favorite
B 1700 . The curve expects A to score .240 .
A wins · upset
draw
B wins · expected
stage — K
margin — G
friendly · pick a result
±0.0
A 1500.0 · B 1700.0 — the moves sum to 0
This isn't our invention — it's
FIFA's . Since 2018 the official world ranking runs this exact
update — they call it "SUM" . We turn two dials they leave fixed:
÷400 not ÷600, and the margin counts.
Source: FIFA ranking procedure → research/fifa-formula.md
even FIFA agrees — one number is enough.
Presenter notes — P4 · the update + the weights
Beat (the bit): play B wins · expected first — the dots barely move
(−4.8 in a friendly). "The model yawns. It already knew." Then A wins — +15.2, three
times the move. Surprise is the signal.
Crank the dials: same 1–0 upset — friendly +15.2 → World Cup +45.6 → 5–0 at
a World Cup +91.2 . "Beat someone good, when it matters, by a lot — the number remembers."
Sneaky third beat: a draw still pays the underdog (+5.2) — the model expected A to lose.
Cocky: "The official FIFA world ranking is this napkin with the dials taped
down." · "Every point A wins, B loses. No inflation, no committee, no vibes."
Hole to feed Thomas: "FIFA divides by 600 — flatter. Maybe FIFA knows
something you don't?" Concede the instinct, then: we tested both out-of-sample — steeper plus
margin predicts better. If he pushes on recency/form: we tested time-decay and down-weighting
friendlies too — both hurt. The update is already self-correcting: over-rated teams give the
points back.
Don't: say "K-factor" more than once. The dials are "how much the game
counts." Draws disable the margin dial — that's on purpose, don't fumble it.
The first crack — regions barely play each other
The update trusts a chain of results . Between continents, the chain frays.
Every game since 2010. The dense diagonal is regions playing themselves; the faint cells are
the bridges between them — 14.5% of games cross regions,
and 73% of those are friendlies.
THE PATCH — one number per confederation
Applied only when two regions meet — worth up to
±9% in expected goals. Tested on held-out games: better. Shipped.
an even AFC vs CAF tie:
▶ Apply the region fix
okay: one number per team… plus one per continent.
Presenter notes — P5 · Elo's blind spot
Beat: point at the matrix — six dense islands, faint everything-else.
"Beat someone who beat someone" only moves strength around if somebody actually plays
somebody. Then the demo: even AFC-vs-CAF tie → apply the fix → the goal rates tilt.
Cocky: "I caught this bug myself, before the tournament, and shipped the
patch. Vibes has never once audited itself."
Holes to feed Thomas: ① "so your one number was just… wrong?" — concede
fast: between continents, yes, by up to ±9% in goals — that's why it's patched. ② "how do you
know that's not luck?" — the group stage ran systematically off our expectation per region
(biggest samples, opposite directions), and the offset wins on held-out games: cross-region
log-loss −0.021, overall −0.003, survives dropping OFC. Don't read intervals on air.
③ "why not one big pool?" — this IS the pool; the games to link it don't exist (~37
competitive cross-region games a year).
Don't: say "log-goal-rate" — the on-air unit is goals. Don't explain how
goals become win% yet; that's the next slide.
The balk — the one-number boast gets red-penned
Fine: every team gets two numbers — ATTACK and DEFENSE .
MATH: "One number per team. That's all I need." — logged, pre-tournament
A win% can't tell 1–0 from 5–0 .
Soccer is 2.7 goals a game and 1 in 4 ends level —
goals carry the signal:
two ratings per team →
goal rates →
a whole scoreline
THE COMPLEXITY PAYS RENT
Held-out log-loss 0.8699 vs the one-number
baseline's 0.8779 . This engine makes every number in the deck.
Argentina vs Croatia
expected goals
– vs – — the whole distribution:
draws, upsets and blowouts fall out for free.
just kidding.
Presenter notes — P6 · the balk
Beat (the balk): the deck red-pens my own logged boast on screen. Own it:
"you logged me. Fine — two numbers per team." Then the receipt: the complexity is paid for,
held-out 0.8699 vs 0.8779 . Never upgrade the model without a receipt.
The "just kidding" bit (hidden key: X ): start the earnest
explanation — "so every team gets an attack rating and a defense rating, your attack meets
their defen—" stop mid-word. "…just kidding. I don't even need a two-rating model." Press
X (nothing visible on the slide — it looks like the deck did it by itself): the page
crosses itself out. Hold the silence while the X draws. Then, deadpan: "except every number
you're about to see runs on it. The receipt says it's better. I just wanted to feel
something." Press X again to restore. The deck red-penned me; I red-penned it back —
we're even.
Payoff: remember P3's scrawl — the curve ran hot, .760 vs .687? The fitted
engine is what closes that gap. Say it while pointing at the win/draw/lose boxes.
The noise shield (folded from the cut skill+noise slide): soccer is the
lowest-scoring major sport — a side 15% better on goal rate wins only ~47% outright
(~25% of games draw); at basketball-level scoring the same edge wins ~77% . That's why
the gut has a chance here at all. Use sparingly — it's also my excuse if the bracket busts,
and Thomas will notice.
Cocky: "Your attack meets their defense. It's Poisson per side, if anyone
asks. Nobody ask."
Holes to feed Thomas: ① "you said one number was ALL you needed" — let him
land it clean; that's the arc working. ② "why stop at two? form, injuries, your left back?" —
concede it's a ladder; do NOT spend the ML feature-head tease here, it's the season closer.
Don't: no formulas, don't say "log-loss" without "lower = better", don't
say Poisson unprompted.
Reality check — every World Cup game ever, one dot each
The favorite only wins 57% of the time.
All 964 World Cup
finals games, 1930–2022. "Favorite" = higher Elo at kickoff, host bump included — our own replay,
game by game. Dot area = games.
Below the diagonal, the favorite won. On it,
a draw. The triangle above holds one game in five — and it's not the ratings,
it's the sport:
■ favorite wins57%
■ draw22%
■ upset21%
62%
end level or a single goal apart —
2 in 5 games, the better team
Presenter notes — P7 · one dot per game
Beat: don't explain the axes — let the shape talk. "That blob in the corner is
the entire history of the World Cup." The four biggest dots are 1–0, 2–1, 1–1, 0–0: 395 of 964
games — 41% of everything that has ever happened is one of four scorelines. Then walk the zones:
below the line the favorite won (57%), the line itself is draws (22%), the fat triangle above is
upsets (21%). Land the scrawl: 2 in 5 games, the better team doesn't win.
The mechanism (one sentence, don't lecture): not mystery, low scoring — 62% of
games end level or one goal apart. One deflection, one offside call, and the dot moves across the
line. This is why the balk slide models goals: the whole sport lives inside two of them.
Thomas's gift (planted on purpose): this chart is his entire thesis — let him
gloat. "42% chaos! Why are we even modeling?" Recovery is calibration, not denial: the model never
claimed favorites always win, it claims to know how often . Bucketed by its own forecast:
70–80% calls won 65%, 80–90% calls won 74%. It isn't wrong 42% of the time — it's right about
the 42% (P3 callback). Vibes can't tell you which games are the coin flips. The column can.
The corner dots (fun): in 92 years the underdog has scored 7+ exactly
twice : Turkey 7–0 South Korea in 1954, and the 1–7. It's deliberately unlabeled here — the
story lands two slides ahead (the 2014 card); flip back then and point at the lonely top-corner dot.
Honesty footnote if pressed: the 1954 one is a rating artifact — both debutants
sat at ~1500, so "favorite" there was a coin toss. The 1–7 stands alone. The favorite-side blowout
column (16 games, 7+ scored) is all minnow-hunting: Hungary 10–1 El Salvador '82, Germany 8–0 Saudi
Arabia '02, Spain 7–0 Costa Rica '22. The 12-goal dot far east is Austria 7–5 Switzerland, 1954.
Bridge (this is the whole reason the slide exists): "one game, the favorite is
a 57." → next slide prices what the rating buys; the one after multiplies it five rounds deep.
Don't: don't say "bubble chart", don't re-derive Elo, don't read percentages off
the readout twice. One claim — 57 — and out.
The counterpunch — so what does the rating actually buy?
Being 300 points better wins you 3 games out of 4.
Same 964 games as the
last slide: rating gap across, final margin up. Column headers = how often that column's favorite
actually won.
Read it by columns — every gap bucket is
a real, lived win rate:
45% → 76%
how often the favorite actually wins,
even ratings vs 300+ points.
same edge in
goals: about one (r = 0.21) — the margin is where the luck lives
the signal is real.
Presenter notes — P8 · gap vs margin
Beat (this is the answer to the last slide): Thomas just got his best chart of
the night — don't take it back, price it. "You're right, 2 in 5 the better team doesn't win. Here's
what being better IS worth." Read the strip left to right like a payout table: 45 → 51 → 53 → 66 →
69 → 76 . Each number is just the share of blue dots in that column — real games, not the
formula. Then wave at the cloud: everything around it is Tuesday. The two sentences that matter:
the signal is real, and it's outnumbered.
Two currencies (the chat Eric wanted): the same 300 points is HUGE in win terms
(45% → 76%, losses 28% → 10%) and tiny on the scoreboard (about one goal, r = 0.21). Not a
contradiction — the sport is the exchange rate: soccer is so low-scoring that one expected goal of
edge IS dominance . An 85%-grade favorite still only wins by a goal, which is exactly why they
still lose outright 1 in 10 and why brackets die. (P3's curve said 300 pts ≈ 85% expected score;
these columns are that curve showing up in live games — calibration receipt, again.)
Why MATH still wins (the compounding line): a 5% edge on one game is nothing —
which is exactly why vibes feel fine per-game. But the bracket is 31 picks, and a small real edge
compounded 31 times is the whole ballgame. "You can out-vibe me on a game. You can't out-vibe me
thirty-one times."
The annotated dots (all from our own results.csv): Cameroon 1–0 Brazil (2022) is
the biggest-gap upset in World Cup history by our replay — 532 points. Saudi Arabia 2–1 Argentina
(2022): 445 points, and Argentina won the whole tournament anyway — losing to a 445-underdog
and lifting the trophy are the same month's data. Unlabeled but down there too: England 0–1 USA
1950 (430), Algeria over West Germany 1982 (330), South Korea 2–0 Germany 2018 (325).
Hole to feed Thomas (planted, now the small line under the box): "your whole
model is a 0.2 correlation?!" — concede the number, then reframe: margin is the noisiest possible
target, and the model doesn't bet margins — it prices outcomes . On outcomes, the columns
above ARE the receipt: the forecast and the lived win rate climb together. r = 0.21 on
margins and calibrated on win probability are the same model doing its job.
If he asks why the last column is so wide / why not slice finer: 300+ is only
68 games, and 400+ alone is 15 (win rate dips to 67% out there — Cameroon lives in it). Seeding
and qualification killed the giant gaps; don't over-read small n at the edge.
Don't: don't say "r-squared" or "variance explained" — the small line already
says it in English. Don't re-litigate the 57% — it was conceded last slide. Columns up, cloud
around, out.
The format — survive five knockouts in a row
Even the best team usually loses this thing.
THE MODEL'S FAVORITE — LAST FIVE WORLD CUPS · CLICK ONE
One soccer game already has a lot of luck in it. Single
elimination makes you survive it round after round — and probabilities don't add,
they multiply. The favorite's real path:
Model win % per game, rated at that
tournament's kickoff — our own Elo replay of the full match record.
multiply the whole path
37%
to win it from the last 16 — as the favorite
—
2026 favorite Argentina, same math: ~23%
even the favorite is a 1-in-4 shot.
Presenter notes — P9 · five rounds of luck
Beat (click left to right — the model's own favorite, five straight cups):
2006 Brazil — out at the 60% game (Zidane's masterclass). 2010 Spain — the one
favorite who DELIVERED… and even they lost their opener, then won four straight 1–0s
("winning looks like nearly losing"). 2014 Brazil — 37% path at home, the 70% game
ended 1–7. 2018 Brazil — died at the 76% game. 2022 Brazil — cleared the 88%,
died at the 80% on penalties. Land it: "the model's favorite, five tournaments: one title,
four funerals. That's not the model failing — no path multiplies past ~40%. Favorites are
SUPPOSED to lose this."
The meta-line (fun to chat): Brazil was the model's #1 in four of the last
five — zero titles. Bonus footnotes: raw Elo 2014 actually had Spain #1 by 9 points
(they went out in the GROUP, losing 1–5 to the Dutch — home advantage made Brazil the pick);
2018's defending champs Germany were the model's #2 and finished dead last in their group,
first opening-round exit since 1938. 2010 Spain's group loss row is the counter-lesson:
a group game can be lost — the bracket forgives nothing.
Receipts (verified): 2006 QF France 1–0 (Henry, off Zidane's free kick);
2010 Switzerland upset + four 1–0 knockouts (Iniesta 116'); 2014 Brazil 1–7 is the biggest
semi-final defeat in WC history; 2018 Belgium 2–1; 2022 Croatia 4–2 on pens. Ghost rows =
whoever actually ended up in that bracket slot. Win %s are our Elo replay frozen at each
tournament's kickoff (2014 includes Brazil's home +100); strictly it's Elo "expected score",
draws split — close enough, don't caveat on air.
If the 1–7 comes up (it will) — "so the rating was wrong?":
The loss wasn't the anomaly. The model said 70/30, and 30% happens three times in
ten. One game can't falsify a probability — 17,915 games of calibration can (P3).The margin was. Our data: 19 World-Cup-finals games since 1970 had a side score 6+ —
every other victim was a minnow (North Korea, Panama, Costa Rica). Brazil is the only
elite team it ever happened to.But it wasn't from nowhere. Germany 2010–14: 2.49 goals/game over 65 matches,
and they'd already put FOUR past England, Argentina and Portugal at World Cups. High-scoring
was their pattern; seven was its tail.What the model couldn't see: no Neymar (fractured vertebra), no Thiago Silva
(suspended). The rating is roster-blind — concede this hole, it's real. (It's the
season-closer thread.)The aftermath is P4 live: K60 × G2.125 × (0−.702) → Brazil −90 points
overnight , Germany +90 → world #1, won the final four days later. The number got
shocked; the number learned.
Bridge to 2026: point at the readout's bottom line — "the machine gives
this year's favorite, Argentina, 23%. Same math. The best team on Earth loses this tournament
three times out of four."
The bit — chalk defense (plant it here): Thomas will call the all-chalk
entry "just picking favorites." Pre-empt: 31 knockout games = 2³¹ ≈ 2.1 billion possible
brackets, and even the single most-likely one is nearly certain to be wrong somewhere. "I'm not
trying to be right — that's impossible. I'm trying to be least wrong. I'm confidently
wrong. Thomas is just wrong."
Format receipts (if asked): 48 teams → 12 groups of 4 → 72 group games;
top 2 per group (24) + 8 best third-places = 32 advance; then single-elim R32→R16→QF→SF→Final —
31 knockout games, 104 total. The Machine (next slide) starts at the real locked Round of 32.
Don't: re-explain per-game luck — the dots slide just spent a whole page on it.
One click-through, one multiplication, move on.
The Machine — it filled in my entry for me
all 31 picks,
MATH's actual
submitted entry — the model's most-likely bracket, zero human picks . The % beside each team is
its chance to win that game . Disagree? Click any team:
10,000 re-simulated tournaments price the disagreement. Real attack/defense
ratings (49,478 internationals, region offset), the real locked Round of 32 .
The model's red pen
↺ my entry
Fill in a bracket → the model flags the
picks it thinks are wrong, worst first.
Presenter notes — P10 · the Machine
Beat: the slide opens already filled — that's the point. "I missed the lock
deadline, so I never got to have opinions. This is the machine's most-likely world, and it is
my actual entry. All 31 picks, zero opinions."
The defense (interactive): invite Thomas to disagree — click any team he
likes better. The red pen prices it instantly ("model gives them 34% there"). "You're not
arguing with me, you're arguing with 49,478 games."
The update segment (press R): the bracket tapes clean; press R
and the real R32 results land on camera — the machine's own entry starts bleeding.
Germany (Paraguay on pens, 4–3) and the Netherlands (Morocco on pens, 3–2) get struck
through in red, and the banked/max line appears atop the red pen. "The model's two dead
picks were both penalty shootouts — the exact place the math admits it has no edge."
Point at a call: click any red-pen entry (or press Tab to cycle
them) and the pick it's talking about lights up on the bracket, swapping halves if needed.
Hole to feed Thomas: "even YOUR champion is only 23%." Concede instantly —
that's last slide's math. "Right. I'm 77% to be wrong about the champion. I'm still less wrong
than you." (Least-wrong framing, P9 callback.)
Don't: re-derive the engine or the offsets here — the receipts live on
earlier slides. This page is theater: the machine turns the crank, the numbers land.
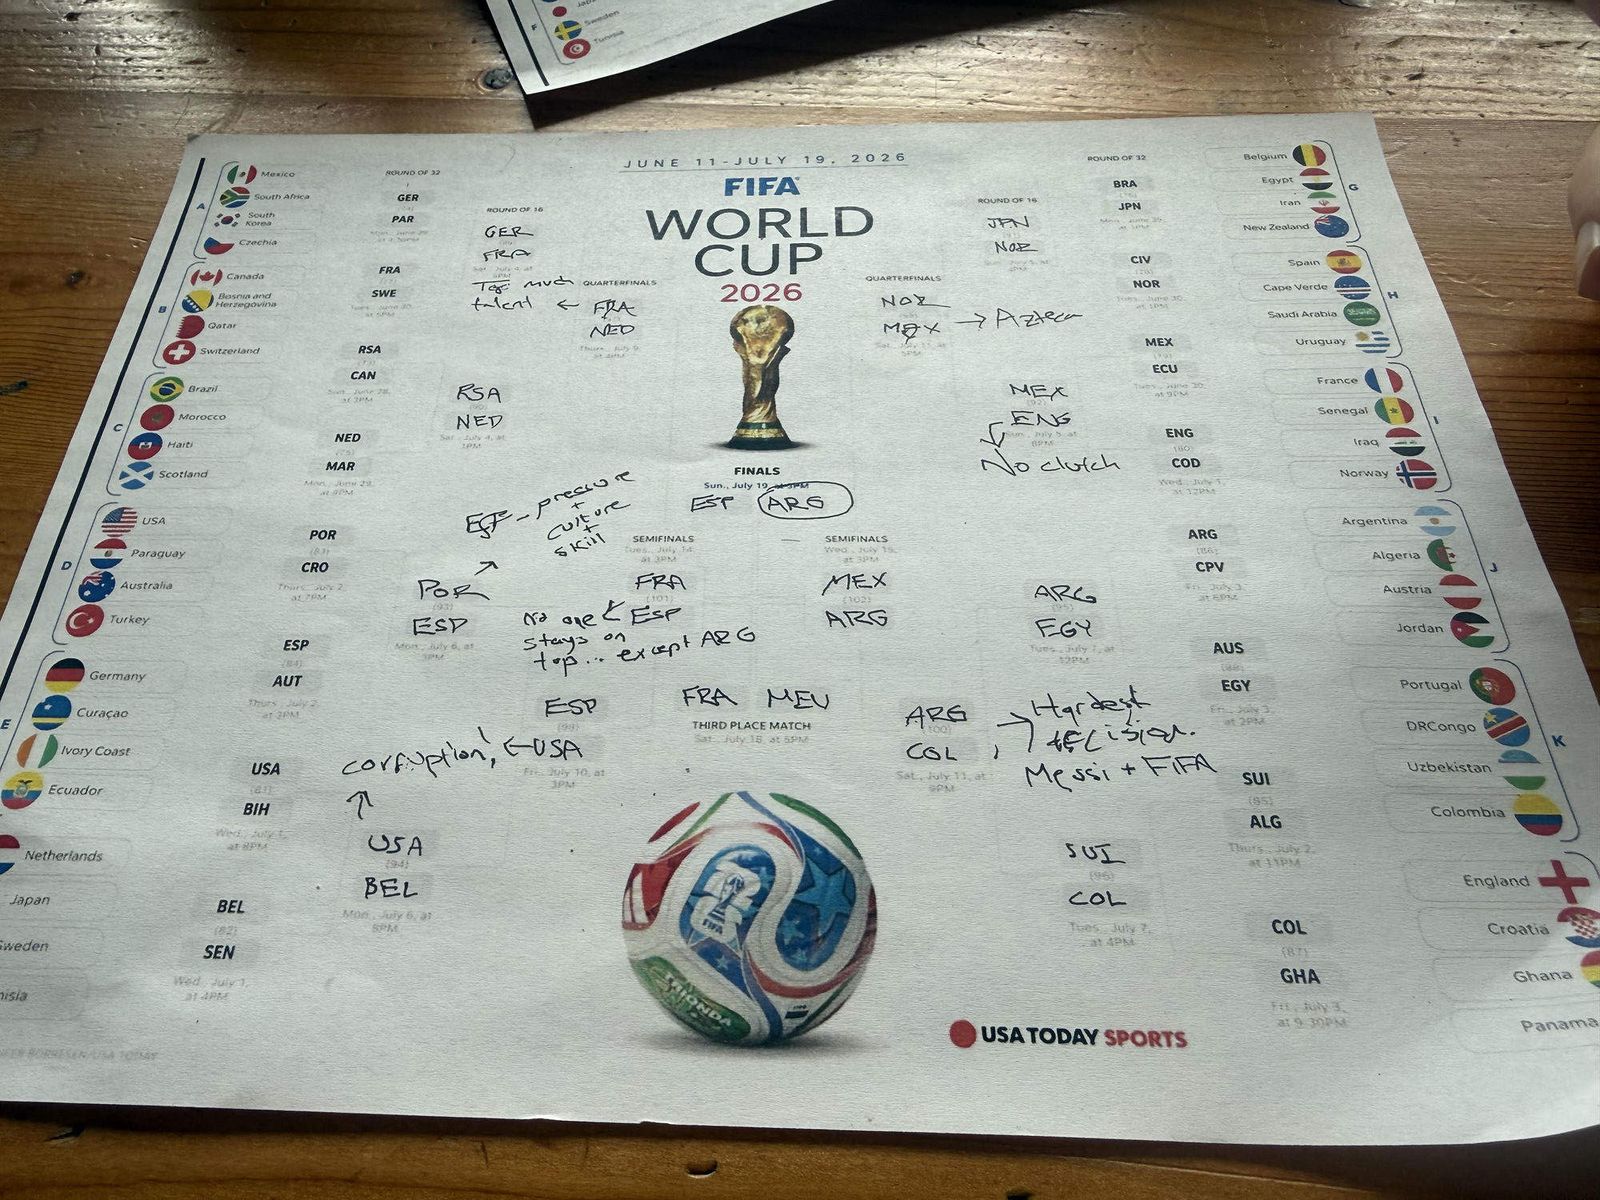
Exhibit A — the actual paper
one pen, zero spreadsheets. Argentina, circled — "Messi + FIFA."
Presenter notes — the paper
Beat: let it breathe. This is the whole show in one photo — the model's
bracket is a database query; this is a guy at a wooden table with a pen. Zoom the camera on
the margins, not the picks.
Read aloud: "corruption! ← USA" · "no clutch" (England) · "no one beats
Spain… except ARG" · "Hardest decision. Messi + FIFA." Then the circle around ARG.
Handoff: "every scrawl on this page is now a number" → next slide,
the same bracket codified and graded.
The showdown — every pick Thomas makes against the model
Fill Thomas's bracket. Each pick is graded against the model's advance
probability for the team he advanced : green = with the model,
yellow = coin-flip, orange/red =
fading the model. A dashed box = the machine picked the
other team (◆M marks its favorite). The redder his bracket, the more he's on vibes.
▸ Thomas's real picks
MATH's bracket
THOMAS'S DEVIATION SCORE
0.0
sum of how far each pick fades the model · pick a champion
His boldest fades
Fill Thomas's bracket → his against-the-model calls, boldest first.
Presenter notes — the showdown
It opens loaded but UNGRADED: his real paper picks — all rounds,
champion included — with the results hidden. Walk the bracket clean, then at the update
segment press R : the real R32 results land live — green ✓ banks points, red pen
kills. Dead: Germany, Netherlands, South Africa, Japan. His Egypt call ("Pharaohs —
Africa Wave") HIT. Press R again to hide for a re-take.
Point at a call: click any boldest-fades entry (or Tab to cycle)
and that pick lights up on the bracket, swapping halves if it lives on the other side.
The spine of his bracket: ESP–ARG final, Argentina lifts it —
"Hardest decision. Messi + FIFA." Hover any pick for his margin scrawl; hover the
ⓘ for the scout card on that team.
Housekeeping: R32 results are in; hold R16 until Jul 8 (edit RESULTS,
redeploy). Press E to dump the click-state as paste-able JSON if he revises live.